Mapping Diversity Along the Wasatch Front
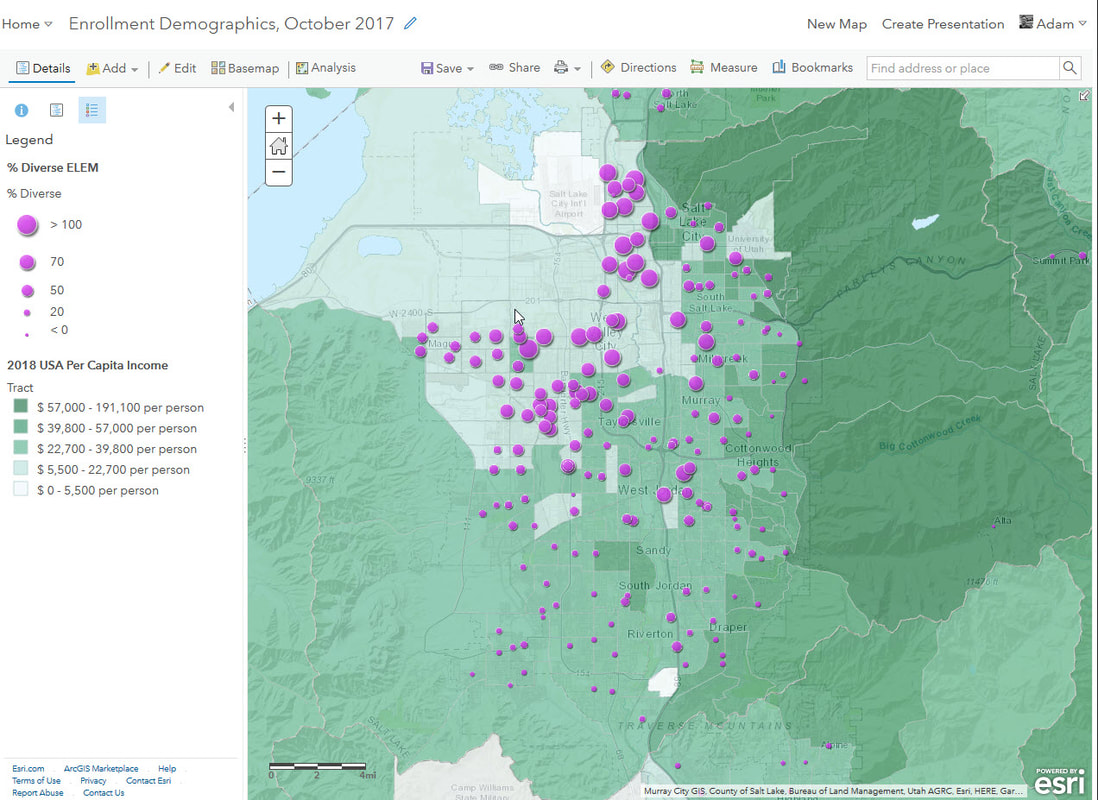
The data for this series of maps from 2018 comes from directly from the Utah State Board of Education and the United States Census Bureau. The school information was determined by removing the Caucasian students from the data and adding everyone else into a single group. Then the "diversity" data was converted into a percent from the whole. The larger the diversity within the school, the larger the circle is represented visually. This data was then compared to 2018 USA Per Capita Income from the U.S. Census Bureau. The map clearly shows that for the majority of diverse schools within the Salt Lake Valley reside in lower income levels of the valley.
Plans are to apply for SLCC's Distinguished Faculty Lecturer when I can update the base maps using Census 2020 data.
Plans are to apply for SLCC's Distinguished Faculty Lecturer when I can update the base maps using Census 2020 data.
Percent Diverse within Public Schools
Click on map to view larger.
|
Click on map to view larger.
|
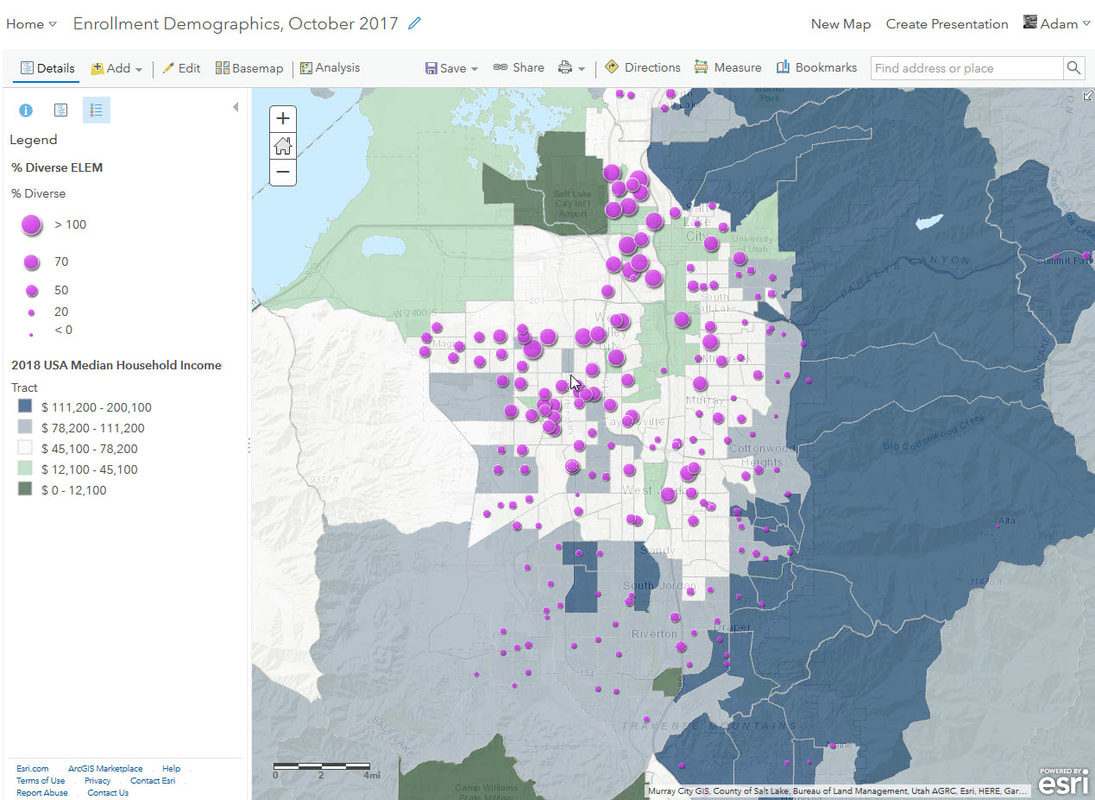
This first series of maps look to compare the diversity of schools within Salt Lake County about U.S. Census data in 2018. The image on the left looks to evaluate the relationship between the diversity of schools and income levels per capita. The map on the right highlights a similar story where more diverse schools reside in areas with lower median household income levels.
Economically Disadvantaged in Public Schools
Click on map to view larger.
|
Click on may to view larger.
|
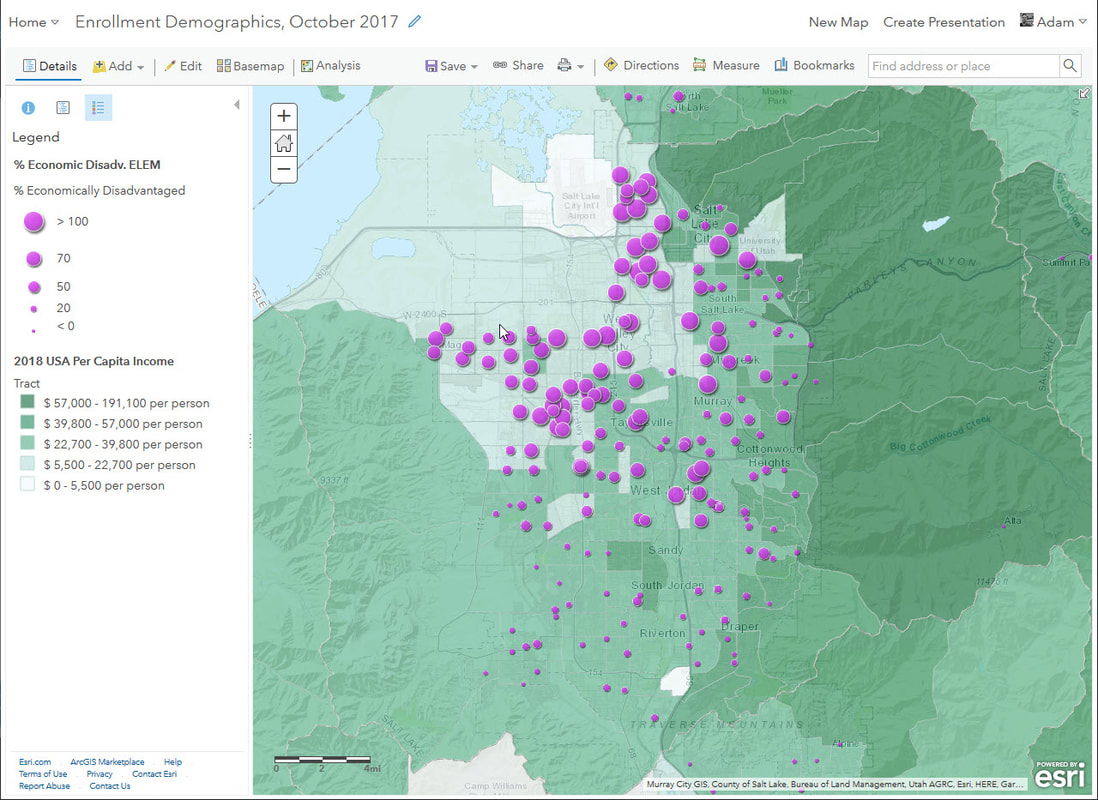
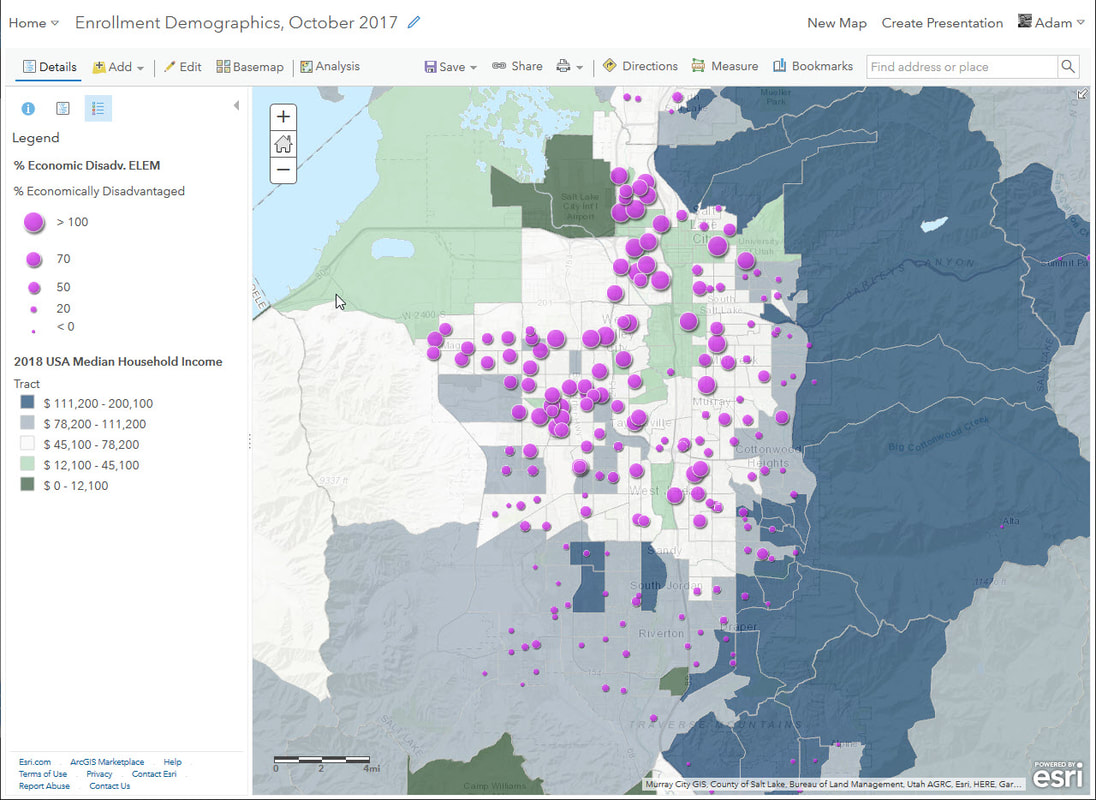
This next series of maps look at "economically disadvantaged" elementary students within Salt Lake County as determined by USBE. A similar spatial pattern emerges from the "diversity" maps above. There appears to be a strong correlation between areas where families are struggling financially in the valley and how we cluster students with economic hardships into the same elementary schools.
English Language Learners in Public Schools
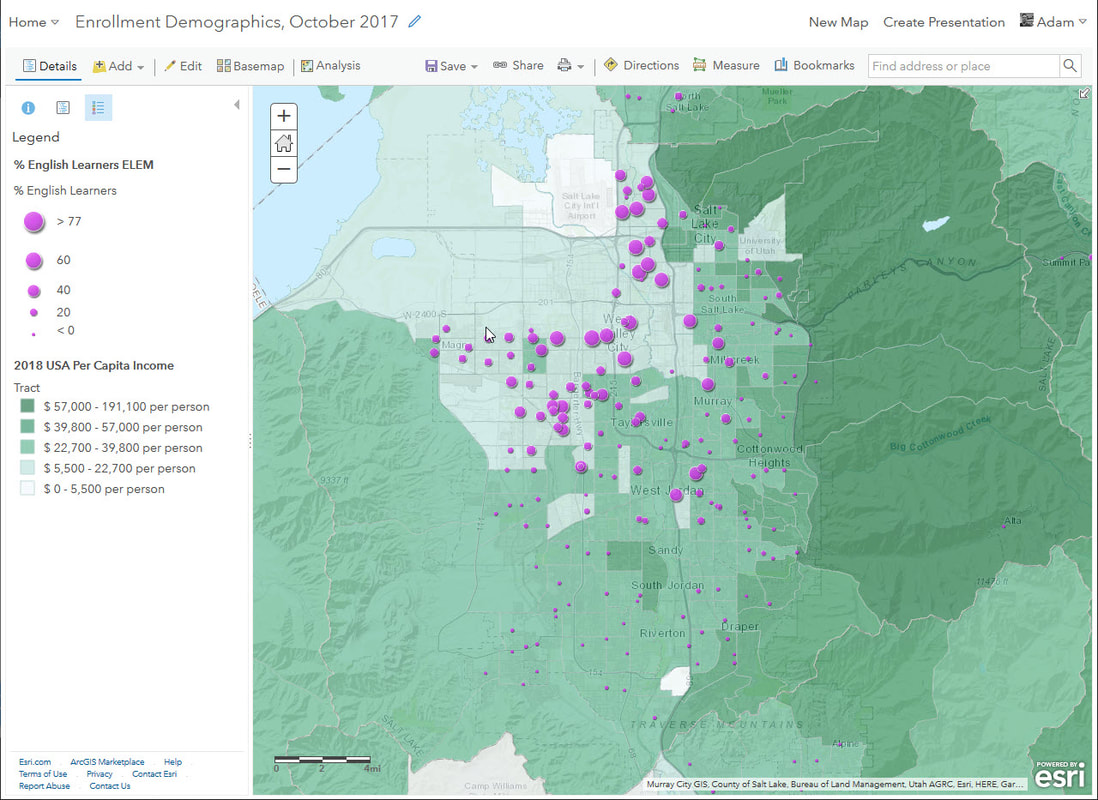
Click on map to view larger.
|
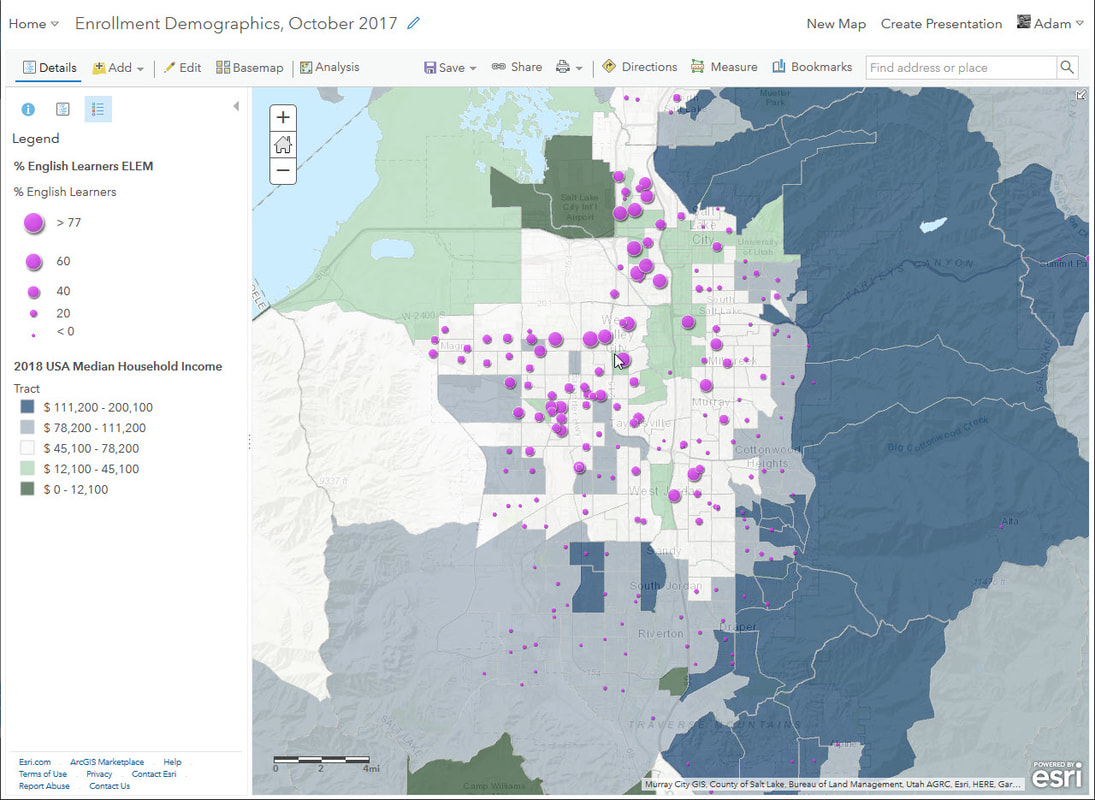
Click on map to view larger
|
These final maps look directly at elementary school students where English is not their primary language spoken at home. Again, children who speak more than one language at home also live in areas struggling more economically than geographic areas more economically well off.
Preliminary Analysis
One of the goals of this research project is to analyze racial and economic segregation along the Wasatch Front. The data analyzing diversity and economically disadvantaged shows segregation between higher and lower economic situations within the valley. Areas with higher student diversity and who do not speak English as their primary language happen to also live in regions of the valley suppressed economically.
This is problematic on multiple levels. Nationally, school district funding relies on property taxes on residents. Communities overwhelmingly white tend to live in wealthier areas, and thus have greater access to property tax revenue. The Washington Post highlighted this problem on February 26, 2019, in their report, "Report finds $23 billion racial funding gap for schools." This economic separation or segregation as documented by the U.S. Census data on the map along the Wasatch Front has a strong spatial correlation to greater diverse schools, economically disadvantaged students, and English Language Learners.
What this means is that students of color and underserved populations do not have the same access to education as students in predominantly white regions of the valley. This will not only impact high school graduation rates but will directly impact the potential for students to succeed in obtaining any credentials in higher education. This, in turn, could either impact our future economy and potentially create a new economic caste system between Caucasian and people of color within the county.
Moving forward, I would like to research the following:
- Apply for the SLCC Distinguished Faculty Lecturer
- Collect USBE demographic data for 2000, 2005, 2010, 2015, and 2020
- Collect U.S. Census 2020 data when it becomes available
- Analyze every specific demographic group the data from USBE provides, including gender
- Analyze high school graduation rates regarding race/ethnicity, English Language Learners, and economics
- Analyze and possibly model student demographic trends from high school to Salt Lake Community College
